PCR vs qPCR vs RT-qPCR: Key Differences
A scientific comparison of conventional PCR, quantitative real-time PCR and reverse transcription qPCR, explaining amplification, fluorescence, Cq analysis, controls and research applications.
PCR vs qPCR vs RT-qPCR: Key Differences, Experimental Methods and Data Interpretation
Polymerase chain reaction transformed molecular biology by enabling scientists to amplify selected DNA sequences. Quantitative real-time PCR and reverse transcription workflows extend this principle to fluorescence-based measurements and RNA analysis. Explore their molecular foundations, experimental methods, scientific data and biotechnology applications.
Conventional PCR, qPCR and RT-qPCR are related but distinct molecular biology workflows. Although each can involve targeted DNA amplification, they differ in sample preparation, detection and quantitative interpretation. Understanding these differences is essential for choosing appropriate research methods and generating reliable experimental evidence.
Why Scientists Amplify DNA
DNA contains nucleotide sequences that store genetic information and contribute to the development, structure and function of living organisms. In many research samples, a sequence of interest may be present in only a small quantity. Detecting or analyzing that sequence directly can therefore be challenging.
Polymerase chain reaction (PCR) solves this problem by amplifying a selected DNA region. The technique uses short DNA primers that identify the boundaries of the intended target sequence, a thermostable DNA polymerase and repeated cycles of controlled heating and cooling.
The result is an increased quantity of a defined DNA fragment known as an amplicon. PCR has consequently become an important technique in genetics, molecular biology, microbiology, molecular cloning and biotechnology research.
However, the presence of amplified DNA does not automatically reveal the initial quantity of the target. That distinction leads to the development of quantitative and real-time PCR technologies.
How Conventional PCR Works
A standard PCR reaction generally contains DNA template, forward and reverse primers, DNA polymerase, nucleotides, magnesium ions and an appropriate buffer system. These components undergo repeated temperature cycles that promote DNA strand separation, primer binding and DNA synthesis.
During denaturation, the double-stranded DNA template separates into individual strands. During annealing, primers hybridize to complementary regions. During extension, DNA polymerase adds nucleotides to synthesize new DNA strands.
Repeated cycling can produce approximately exponential amplification during the early reaction stages. However, real amplification efficiency depends on reaction chemistry, primer specificity, template quality and the presence of inhibitory substances.
Conventional PCR commonly detects products after amplification. Agarose gel electrophoresis, for example, separates DNA fragments according to their electrophoretic mobility, allowing researchers to assess whether products of an expected size are present.
Polymerase Chain Reaction (PCR): How DNA Amplification Works
Watch a scientific explanation of DNA primers, polymerase activity, temperature cycling and repeated DNA amplification.
What Makes Real-Time qPCR Different?
Quantitative real-time PCR, commonly called qPCR, measures fluorescence during amplification rather than examining only a final product. Specialized instruments monitor fluorescent reporters whose signals are associated with the accumulation of amplified DNA.
Early amplification signals may be indistinguishable from background. As more DNA accumulates, fluorescence increases. A quantification cycle, or Cq, can be identified when the amplification signal crosses a defined fluorescence threshold. The older term Ct is also widely used in the literature.
For comparable amplification efficiencies, samples containing more initial target molecules generally reach the threshold at earlier cycles. Samples with lower starting target abundance reach the threshold later.
Unlike conventional end-point PCR, qPCR provides quantitative information within an appropriately validated measurement range. However, accurate interpretation depends on reaction efficiency, calibration, background and experimental controls.
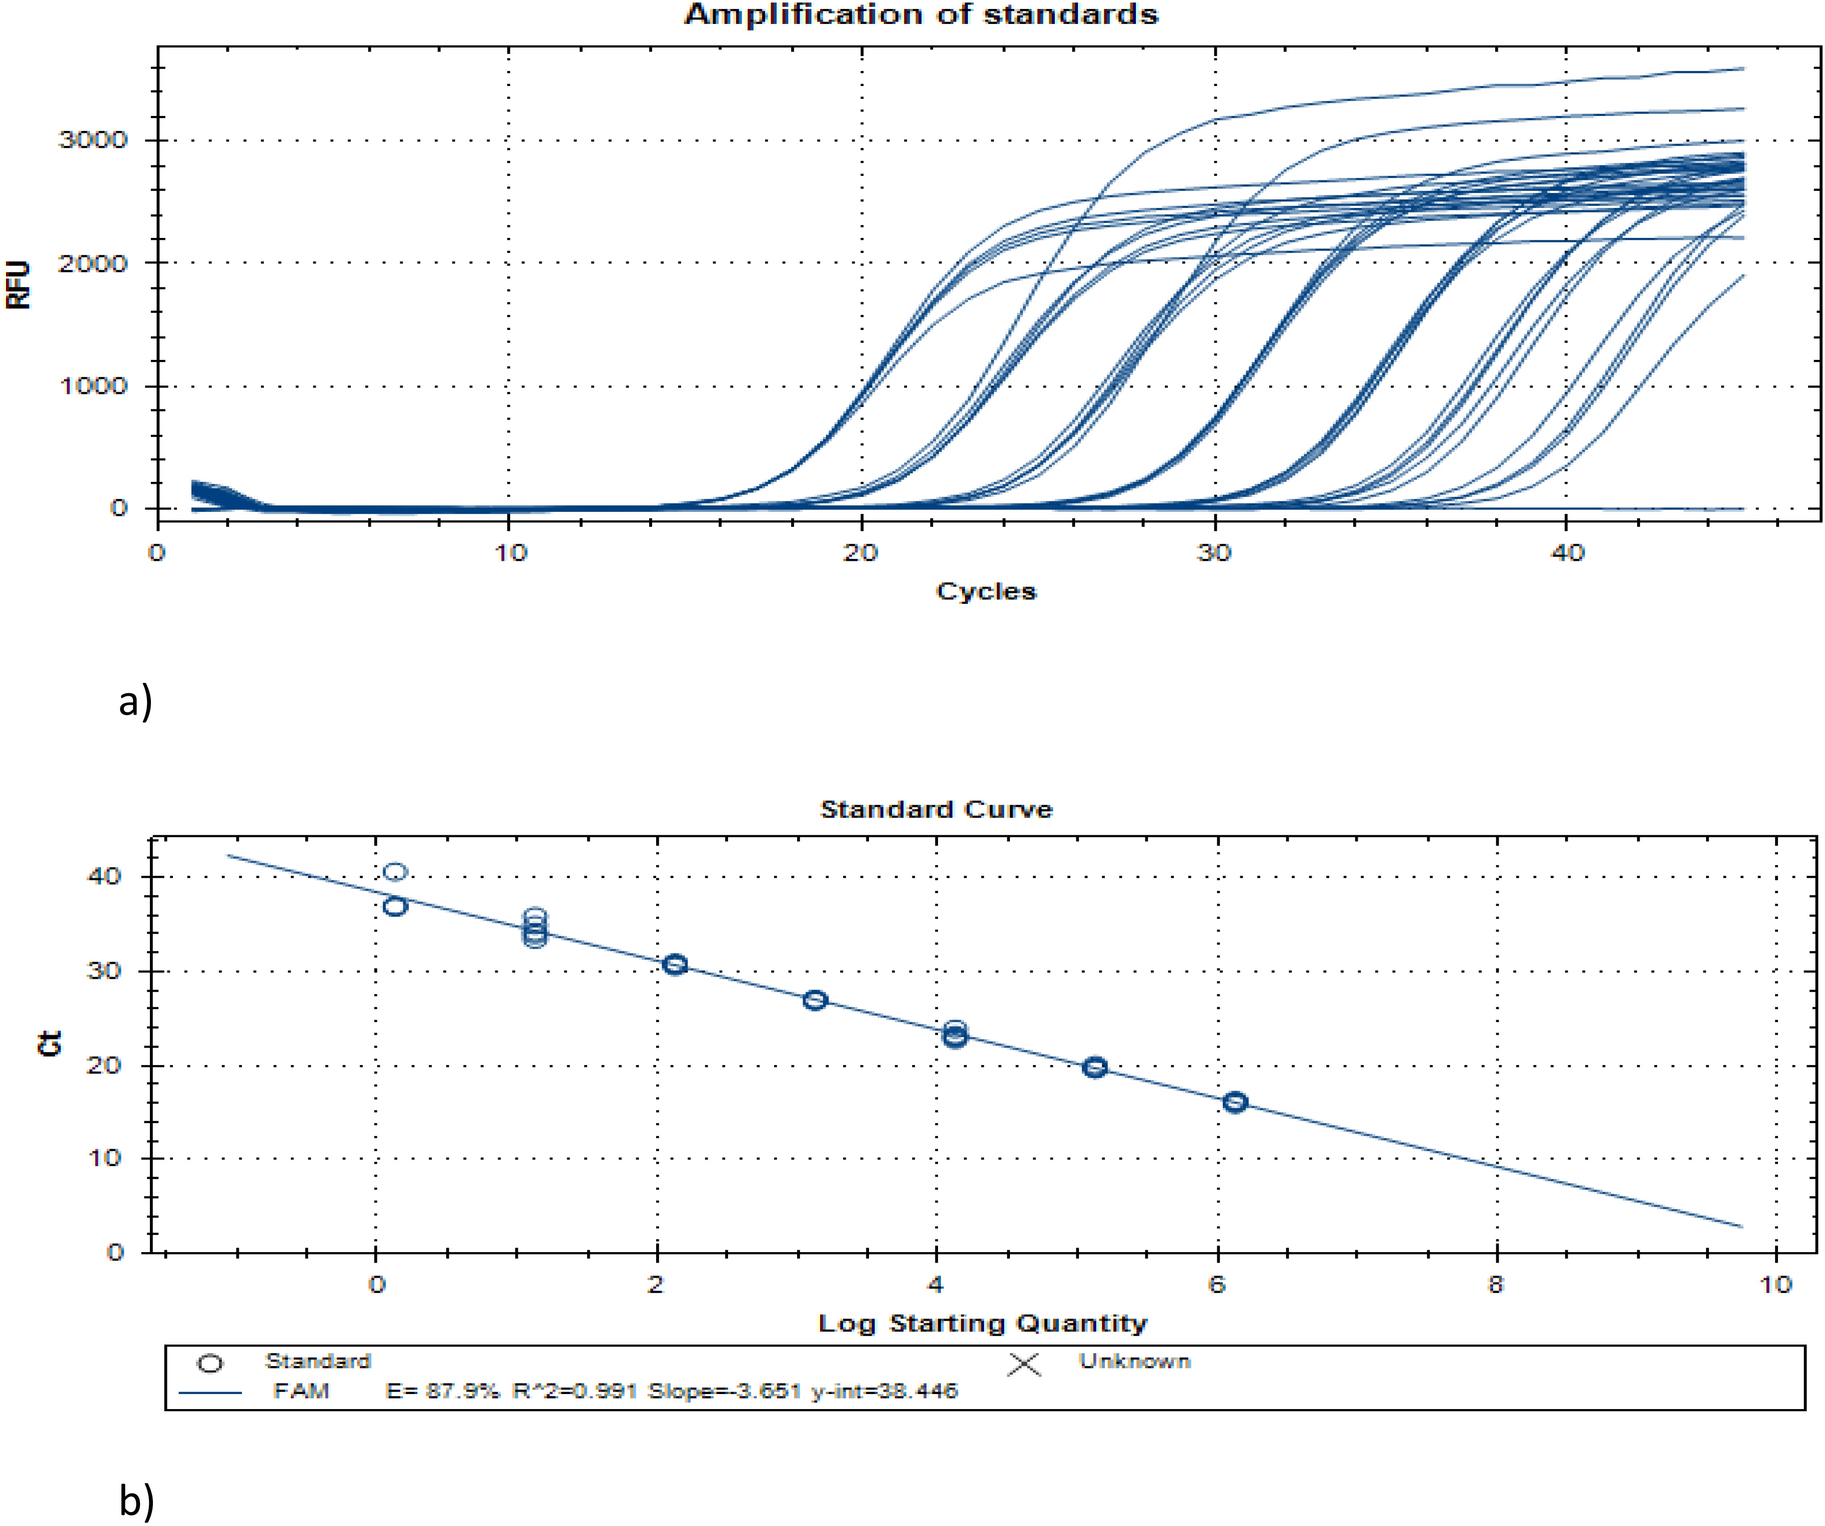
The amplification curves demonstrate why starting target quantity matters. Reactions containing different target amounts can produce distinct fluorescence trajectories and Cq values even when they amplify the same target sequence.
How RT-qPCR Measures RNA-Derived Targets
RNA plays a central role in gene expression and biological regulation. For example, messenger RNA molecules carry coding information that can be translated into proteins. Scientists frequently investigate changes in transcript abundance to understand cellular responses to experimental conditions.
Standard PCR DNA polymerases require DNA templates. To measure RNA using PCR-based methods, researchers first convert RNA into complementary DNA (cDNA) using an enzyme called reverse transcriptase.
The resulting cDNA becomes the template for quantitative PCR amplification. This combined process is called reverse transcription quantitative PCR, or RT-qPCR.
In a one-step RT-qPCR workflow, reverse transcription and PCR amplification occur within one overall reaction setup. In a two-step workflow, cDNA is synthesized separately before being introduced into subsequent qPCR reactions.
Real-Time PCR and RNA Expression Analysis
An illustrated academic guide covering reverse transcription, fluorescence-based detection and quantitative analysis of RNA-derived targets.
Explore EMBL-EBI scientific tutorial ↗RNA extraction quality, reverse transcription efficiency and residual genomic DNA can influence RT-qPCR results. RNA-based measurement therefore introduces additional quality requirements compared with direct DNA qPCR.
PCR vs qPCR vs RT-qPCR: Key Differences
Although the three techniques share the principle of DNA amplification, their experimental workflows and scientific outputs are different. Conventional PCR is commonly used for amplifying selected DNA regions, whereas qPCR supports quantitative DNA target measurement.
RT-qPCR extends quantitative analysis to RNA-derived targets by introducing the reverse-transcription step. Researchers select among these techniques according to the question, starting material and required level of measurement.
| Feature | PCR | qPCR | RT-qPCR |
|---|---|---|---|
| Typical starting material | DNA | DNA | RNA |
| Reverse transcription | Not ordinarily required | Not required for DNA | Required |
| Detection | Commonly end-point | Real-time fluorescence | Real-time fluorescence after RT |
| Primary output | Amplified DNA product | Amplification curves and Cq | RNA-derived amplification curves and Cq |
| Typical application | Target amplification and genotyping | DNA target quantification | Gene expression analysis |
| Key limitation | End-point signal rarely provides reliable starting quantities | Quantification depends on calibration and efficiency | RNA integrity and reverse transcription add variability |
For example, verifying the presence of an engineered DNA insertion may require conventional PCR. Measuring the abundance of a selected DNA sequence may require qPCR. Investigating transcriptional changes following a growth-factor treatment may require RT-qPCR.
Fluorescent Dyes, Probes and Melting Curves
qPCR instruments detect light emitted by fluorescent reporters associated with amplification products. Two widely used detection strategies employ DNA-binding dyes or sequence-specific fluorescent probes.
Double-stranded DNA-binding dyes produce increased fluorescence when associated with amplified double-stranded DNA. Their simplicity makes them useful for many qPCR assays, although fluorescence can also arise from unwanted DNA products, including primer dimers.
Hydrolysis probes provide an additional level of sequence-specific recognition. During target amplification, polymerase-associated probe cleavage separates reporter and quencher, producing an increased fluorescence signal.
Melting curve analysis helps investigate amplification products by monitoring fluorescence while the temperature increases. DNA products with different sequence compositions can exhibit different melting transitions. This can reveal additional products, although a single peak does not prove complete specificity.
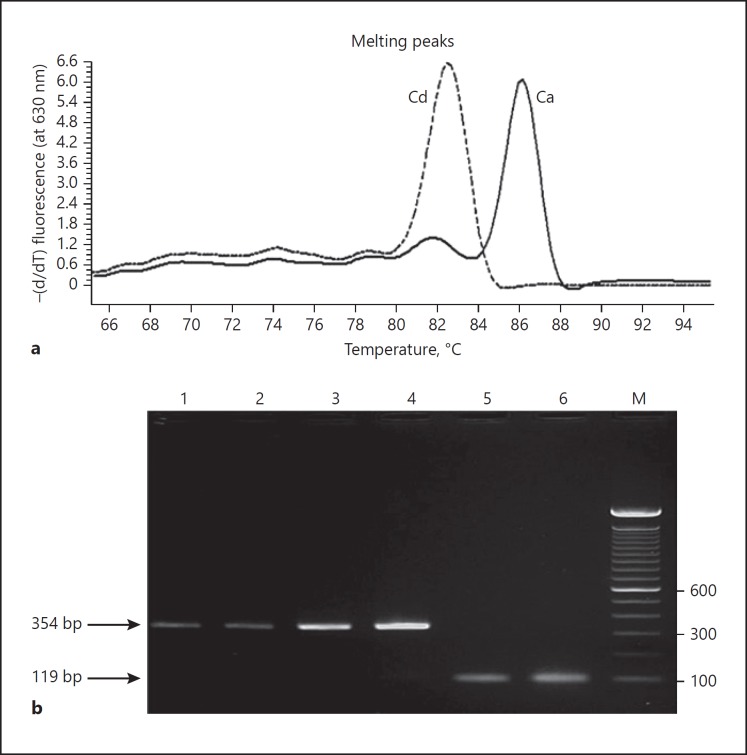
The figure illustrates why melting curve information can provide useful evidence about product identity and heterogeneity. However, sequencing or another independent analytical method may be needed to establish the exact amplified sequence.
How Scientists Ensure Reliable PCR Measurements
Reliable PCR data begin with careful experimental design. Primer sequences must be selected to recognize the intended targets, and assay conditions must support specific amplification. DNA or RNA quality must be appropriate for the measurement being performed.
A no-template control detects amplification when no sample template has been intentionally added. Such amplification may indicate contamination or primer-related artifacts. A positive control confirms that the assay can detect an appropriate target.
For RNA experiments, a no-reverse-transcriptase control can reveal amplification associated with residual DNA. Reference genes or other normalization strategies may be used for expression analysis, but they must be validated for stability in the experimental system.
| Control | Purpose | Interpretation |
|---|---|---|
| No-template control | Detect contamination or nonspecific amplification | Unexpected amplification requires investigation |
| Positive control | Verify target detection | Supports interpretation of negative samples |
| No-RT control | Assess DNA contamination in RNA assays | Detects amplification independent of reverse transcription |
| Dilution series | Evaluate efficiency and potential inhibition | Supports quantitative assay validation |
| Reference genes | Normalize expression measurements | Require stability assessment |
The MIQE guidelines provide a framework for transparent reporting of quantitative PCR research. Their 2025 revision, MIQE 2.0, emphasizes methodological quality, experimental transparency and reliable interpretation.
Understanding Cq Values and Standard Curves
An amplification curve generally includes an initial region where the measured signal is not distinguishable from background, a region of increasing fluorescence associated with exponential amplification, and a later region where amplification approaches a plateau.
Quantification requires appropriately defined analysis conditions. Standard curves are commonly generated from samples containing known target quantities. Plotting Cq against the logarithm of the starting target quantity allows researchers to evaluate analytical response and estimate amplification efficiency.
Accurate quantification depends on the relationship between standard samples and experimental samples. Assay efficiency, precision, dynamic range and potential inhibitors must be considered before converting fluorescence data into quantitative results.
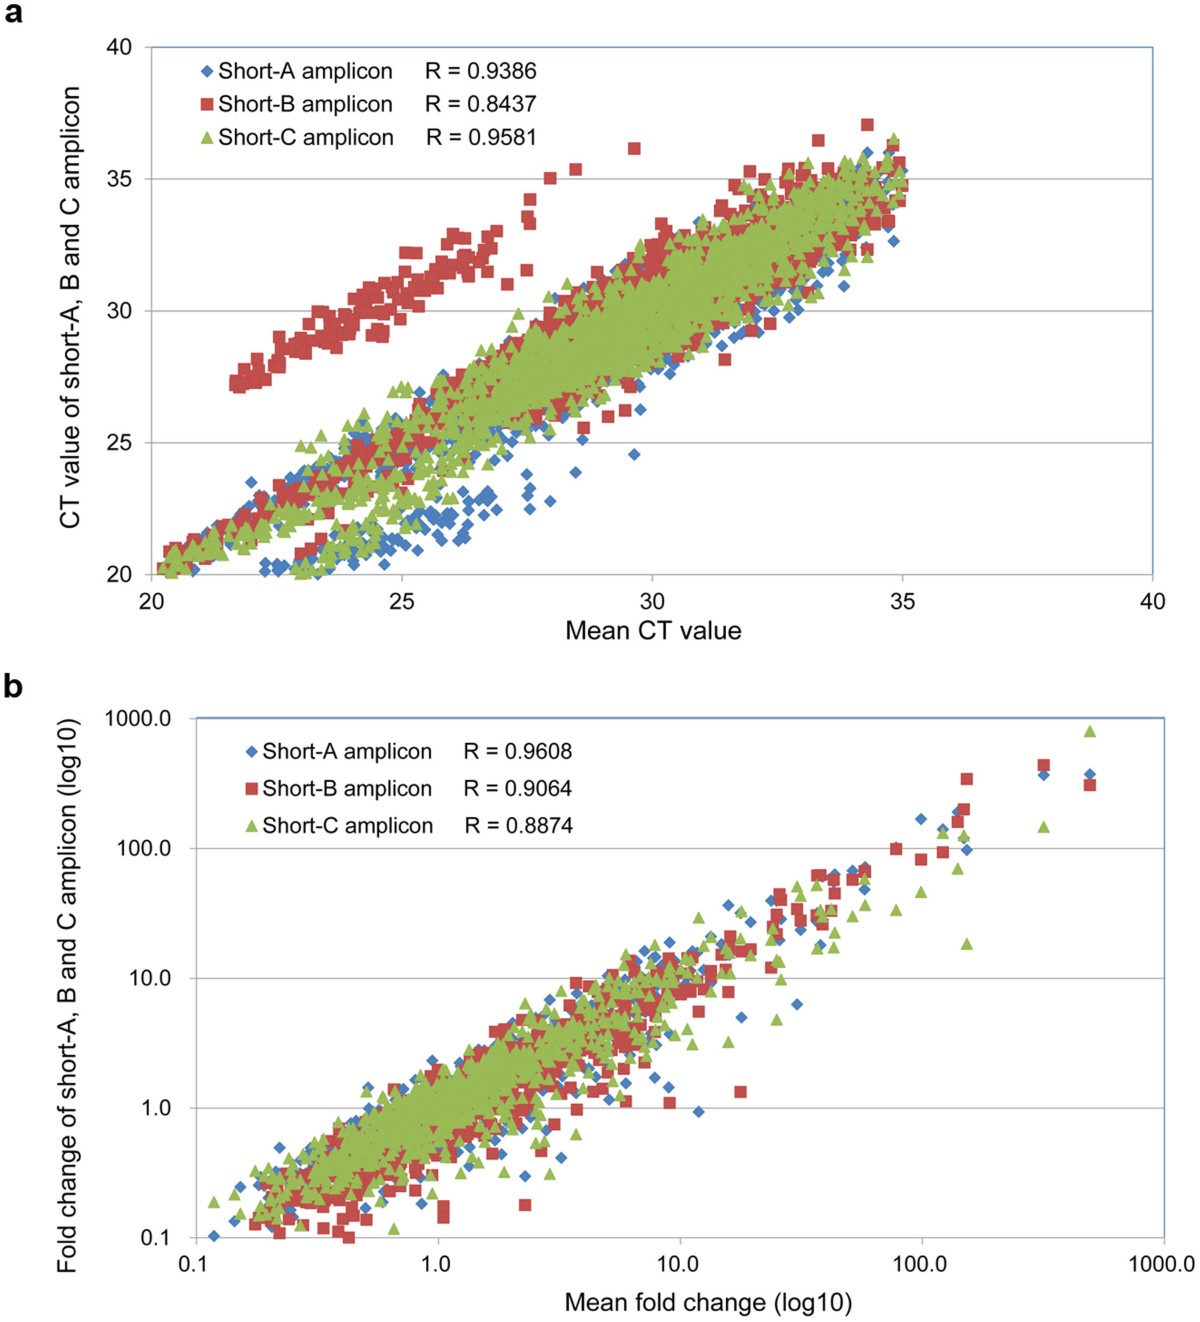
Relative RT-qPCR analysis often normalizes target measurements against appropriate reference measurements before comparing experimental conditions. The frequently used 2^-ΔΔCq calculation requires assumptions about amplification efficiency. When these assumptions are not supported, efficiency-aware methods may be more appropriate.
Biological replicate samples should be distinguished from technical replicate reactions. Technical replicates help evaluate measurement precision, whereas biological replicates provide evidence about variability among independent biological samples.
Gene Expression Research and Experimental Interpretation
Consider a molecular biology experiment investigating how cultured cells respond to an experimental stimulus. Researchers may isolate RNA from treated and untreated samples, perform reverse transcription, and use RT-qPCR to quantify selected transcripts.
Differences in normalized RNA-derived measurements may support the conclusion that the experimental condition is associated with altered transcript abundance. However, RNA abundance alone does not establish protein activity, cellular localization, or the complete biological mechanism involved.
Additional methods may include Western blotting, flow cytometry, microscopy and functional assays. Integrating these measurements can help researchers determine whether transcriptional changes correspond to protein-level or cellular responses.
Researchers must also consider sample quality, reverse transcription efficiency, contamination, amplification artifacts, data normalization and biological variation. These factors influence whether an observed difference represents a reproducible biological effect or a technical source of variability.
From PCR Technology to Modern Biotechnology
PCR-based methods provide fundamental tools for molecular cloning, genotyping, gene expression research, targeted DNA analysis and molecular assay development. Their applications extend across genetics, microbiology, cell biology and biotechnology.
Conventional PCR remains useful for DNA target amplification and product verification. qPCR enables quantitative analysis of selected DNA targets, while RT-qPCR provides a focused approach to investigating RNA-derived molecular measurements.
Modern molecular research also uses digital PCR, high-throughput sequencing and transcriptomic technologies. These approaches complement, rather than entirely replace, established PCR methods. Choosing the best technique requires understanding both its measurement capabilities and its limitations.
The scientific connection is therefore direct: DNA and RNA contain biological information; amplification technologies make selected sequences experimentally accessible; and quantitative analysis helps researchers connect molecular measurements with biological hypotheses.
Reliable discovery depends not only on obtaining a detectable signal, but on designing experiments that support meaningful and reproducible interpretation.
Scientific References
1. Bustin et al. (2025). MIQE 2.0: Revision of the Minimum Information for Publication of Quantitative Real-Time PCR Experiments Guidelines. Read publication ↗
2. Bustin et al. (2009). The MIQE Guidelines: Minimum Information for Publication of Quantitative Real-Time PCR Experiments. Read publication ↗
3. Karlen et al. (2007). Statistical significance of quantitative PCR. BMC Bioinformatics. Read on PubMed Central ↗
4. Sample pooling as a strategy for community monitoring for SARS-CoV-2. Scientific Reports. Read original research ↗
5. Quantitative assessment of short amplicons in FFPE-derived long-chain RNA. Scientific Reports. Read original research ↗
6. EMBL-EBI Training. Real-Time PCR: Fundamentals, Detection and RNA Analysis. Academic learning resource ↗